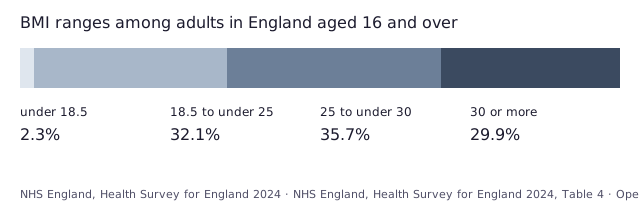
The average BMI of adults aged 16 and over in England was 27.8 in the measured Health Survey for England (HSE) 2024. US adults aged 20 and over averaged 29.8 for women and 29.4 for men in NHANES 2015 to 2018.
Updated:
NHS England, Health Survey for England 2024
Below the reference rangeunder 18.52.3%
Within the reference range18.5 to under 2532.1%
Above the reference range25 to under 3035.7%
Well above the reference range30 or more29.9%
BMI distribution of adults in England aged 16 and over
Copy this HTML to show the chart with a link to this page.
<a href="https://bmiatlas.com/average-bmi/"><img src="https://bmiatlas.com/charts/average-bmi.svg" alt="BMI ranges among adults in England aged 16 and over Source: NHS England, Health Survey for England 2024, measured height and weight." width="640" height="220"></a>
<p>Source: NHS England, Health Survey for England 2024, measured height and weight. NHS England, Health Survey for England 2024, Table 4. Open Government Licence v3.0 https://www.nationalarchives.gov.uk/doc/open-government-licence/version/3/. Chart and sums: bmiatlas.com.</p>
NCHS, NHANES 2015 to 2018
NCHS, NHANES 2015 to 2018
Group
Age
Sample size
Mean BMI
P5
P10
P15
P25
P50
P75
P85
P90
P95
Women
aged 20 and over
5,381
29.8
19.7
21.2
22.1
23.9
28.4
33.9
37.5
40.3
44.6
Women
aged 20 to 29
827
28.3
18.6
19.6
20.4
21.9
26.2
32.9
37.4
39.6
43.3
Women
aged 30 to 39
871
29.9
19.8
21.2
22.0
23.6
28.3
34.2
38.2
41.1
46.1
Women
aged 40 to 49
899
30.7
20.6
22.0
22.8
24.4
28.6
34.8
39.3
43.1
46.6
Women
aged 50 to 59
915
30.3
19.6
21.5
22.5
24.3
29.1
34.2
37.7
41.5
45.7
Women
aged 60 to 69
979
30.3
20.4
22.2
23.2
24.9
29.2
34.7
37.2
39.5
42.9
Women
aged 70 to 79
531
29.8
20.8
22.0
23.3
25.3
28.8
33.3
35.7
37.9
42.1
Women
aged 80 and over
359
28.0
19.9
20.8
22.2
23.8
27.5
30.8
33.5
35.5
39.3
Men
aged 20 and over
5,076
29.4
20.8
22.4
23.3
25.0
28.5
32.8
35.3
37.1
41.0
Men
aged 20 to 29
801
27.6
18.7
20.0
21.0
22.6
26.5
31.6
34.4
36.8
39.5
Men
aged 30 to 39
804
30.3
21.6
23.0
23.8
25.4
28.9
33.7
36.4
38.3
43.4
Men
aged 40 to 49
765
30.1
22.1
23.5
24.7
26.2
29.1
32.8
35.5
38.1
41.8
Men
aged 50 to 59
840
29.8
21.8
22.6
24.0
25.2
29.1
32.8
35.5
37.4
41.7
Men
aged 60 to 69
964
29.9
22.2
23.2
23.9
25.8
28.9
33.3
35.3
37.1
40.3
Men
aged 70 to 79
571
29.2
20.9
22.9
24.1
25.9
28.2
32.8
34.5
35.6
37.2
Men
aged 80 and over
331
27.6
21.1
22.3
22.9
24.3
27.2
30.2
32.3
34.0
35.5
Source: NCHS, NHANES 2015 to 2018, measured height and weight. National Center for Health Statistics, Vital and Health Statistics Series 3 No. 46. Chart and sums: bmiatlas.com.
Survey round: 2015-2018.
NCHS, NHANES August 2021 to August 2023
NCHS, NHANES August 2021 to August 2023
Group
Age
Obesity
Severe obesity
All adults
aged 20 and over
40.3%
9.4%
All adults
aged 20 to 39
35.5%
9.5%
All adults
aged 40 to 59
46.4%
12.0%
All adults
aged 60 and over
38.9%
6.6%
Men
aged 20 and over
39.2%
6.7%
Men
aged 20 to 39
34.3%
6.1%
Men
aged 40 to 59
45.4%
9.2%
Men
aged 60 and over
38.0%
4.3%
Women
aged 20 and over
41.3%
12.1%
Women
aged 20 to 39
36.8%
13.0%
Women
aged 40 to 59
47.4%
14.7%
Women
aged 60 and over
39.6%
8.4%
Severe obesity is part of obesity.
Source: NCHS, NHANES August 2021 to August 2023, measured height and weight. National Center for Health Statistics, NCHS Data Brief No. 508. Chart and sums: bmiatlas.com.
The HSE table and bar show population shares by adult BMI range for England. The NHANES percentile tables show BMI values at published points in the US distribution, rather than a personal rank. The separate NCHS obesity table reports obesity and severe obesity, with severe obesity included in obesity.
Limitations
HSE describes England only and includes adults aged 16 and over; NHANES covers US adults aged 20 and over. The NHANES percentiles and NCHS obesity shares come from different survey periods and are not combined. These population tables do not assess an individual's health.
Frequently asked questions
What is the average BMI in England?
The Health Survey for England (HSE) 2024 reported a measured average BMI of 27.8 for adults aged 16 and over in England. The mean was 27.9 for men and 27.7 for women.
What is the average BMI in the US?
NHANES 2015 to 2018 reported an average BMI of 29.8 for women and 29.4 for men among US adults aged 20 and over.
How do BMI percentiles work for US adults?
NHANES 2015 to 2018 publishes BMI percentiles for US adults aged 20 and over: the median was 28.4 for women and 28.5 for men. A quarter of women were below 23.9 and a quarter of men were below 25.0. This site does not compute a personal percentile.
How many adults in the US have obesity?
An NCHS data brief reported obesity in 40.3% of US adults aged 20 and over in August 2021 to August 2023, with 39.2% for men and 41.3% for women. Severe obesity accounted for 9.4% of adults and is included in obesity. This survey period differs from the NHANES percentile tables.
Can these figures be used for children?
No. The HSE tables cover adults in England from age 16, and the NHANES tables cover US adults from age 20. Children and teenagers use age and sex specific references.
Cite this page
Average BMI in England and the US. bmiatlas.com, Updated 2026-10-12. https://bmiatlas.com/average-bmi/
This calculator gives general reference values and does not replace advice from a doctor. For children and teens under 18, during pregnancy and breastfeeding, for very muscular builds and in older age, the results are of limited use.